
Decades of satellite observations show that the aquifers in the southern part of the state are ailing.

The blaze in central Utah experienced rapid growth during dry, windy days in late July 2025, creating hazy skies throughout the region.

The lake in northwestern Utah displays striking red and green waters that contrast with the region’s surrounding desert, salt flats, and mountainous terrain.
Published Aug 3, 2025
Iceberg A-23A continued to lose sizable pieces of ice during the 2025 austral winter, but it remained the planet’s largest freely floating berg.
Published Aug 2, 2025
The NISAR satellite will detect the movement of land and ice surfaces with centimeter precision, aiding in a range of applications from disaster response and infrastructure monitoring to agricultural management.
Published Jul 31, 2025
Glacial retreat in central Iceland has uncovered an undulating topography riddled with colorful bodies of water.
Published Jul 30, 2025
The waterway in Manitoba flows from the middle out, connecting two rivers bound for Hudson Bay.
Published Jul 29, 2025
That’s a key question for many farmers, and new research may make it easier to develop growing season plans.
Published Jul 28, 2025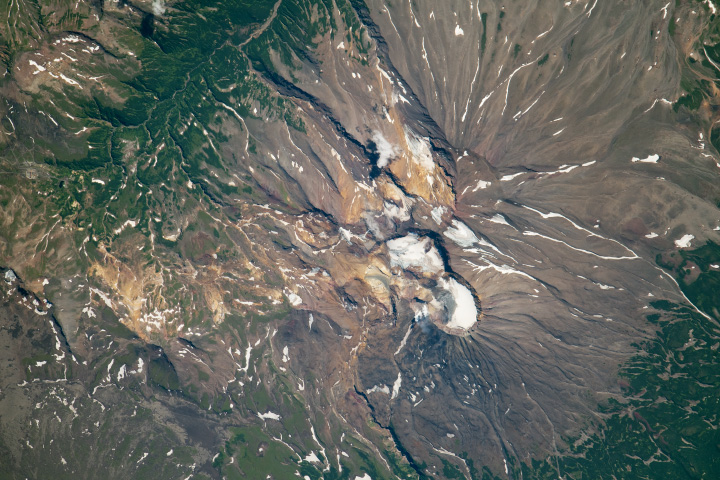
Located on Russia’s Kamchatka Peninsula, the peak’s lofty altitude and chilly latitude help it hang onto snow and glaciers all year long.
Published Jul 27, 2025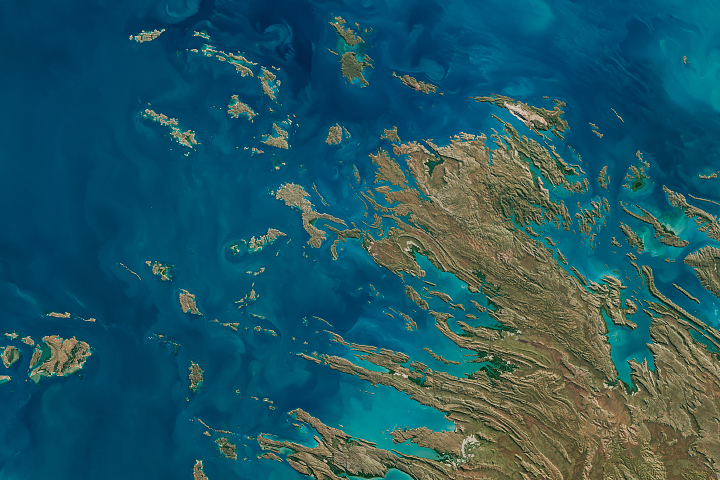
A maze of islands, reefs, and rugged coastline creates dazzling patterns in ocean waters near King Sound in Western Australia, a region known for its powerful tides.
Published Jul 26, 2025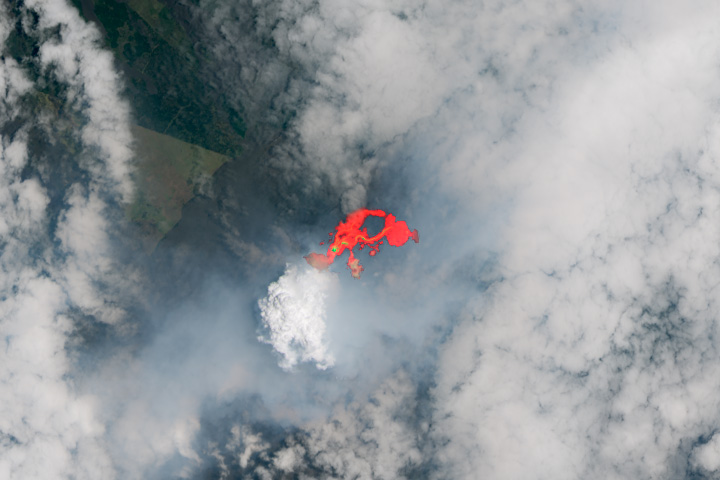
The latest in a string of episodic eruptions produced voluminous fiery flows at the Hawaiian volcano’s summit.
Published Jul 24, 2025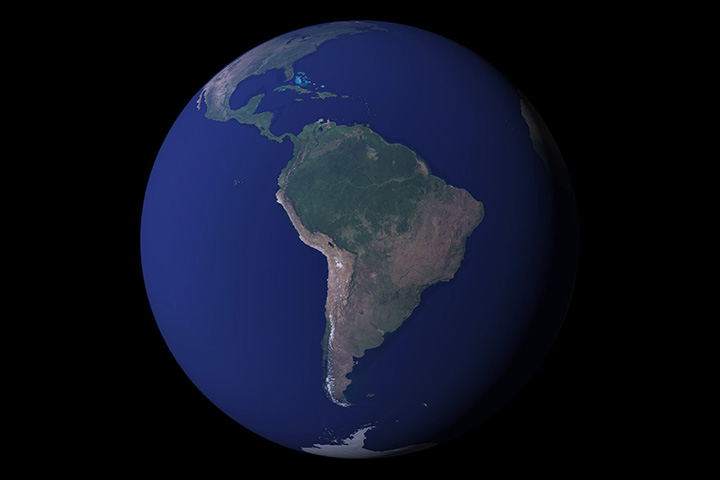
12 months of high-resolution global true color satellite imagery.
Published Oct 13, 2005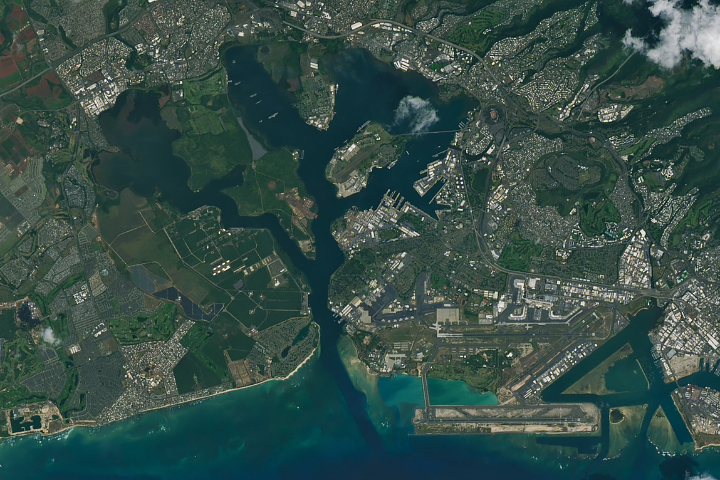
Well-wishers in Hawaii welcomed the astronauts on July 26, 1969, after they landed on the Moon, splashed down in the Pacific, and traveled by aircraft carrier to Pearl Harbor.
Published Jul 24, 2025
Net radiation is the balance between incoming and outgoing energy at the top of the atmosphere. It is the total energy available to influence climate after light and heat are reflected, absorbed, or emitted by clouds and land.
Have you ever wondered what it would be like to live in a different part of the world? What would the weather be like? What kinds of animals would you see? Which plants live there? By investigating these questions, you are learning about biomes.
Published Aug 28, 2020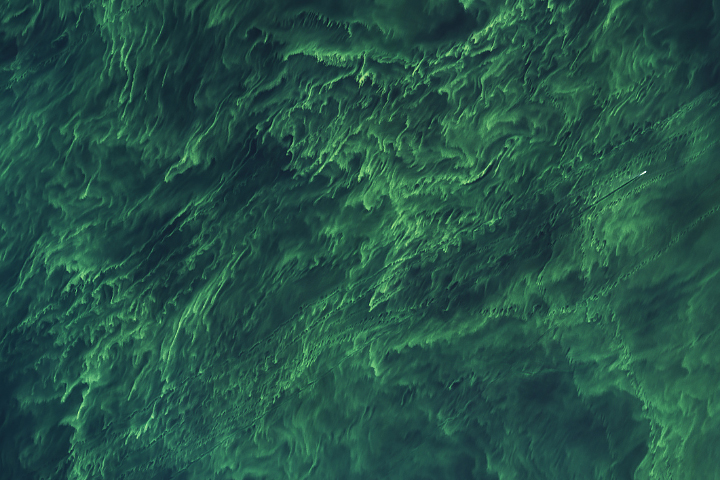
An explosion in the numbers of cyanobacteria transformed the Baltic Sea into a swirling canvas of green in summer 2025.
Published Jul 22, 2025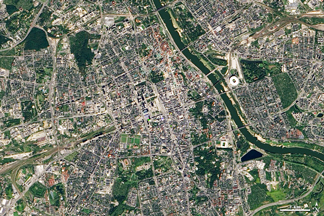
What do you do when presented with a new satellite image? Here's what the Earth Observatory team does to understand the view.
Published Nov 18, 2013
Your challenge is to tell us the location of the satellite image and why it is interesting.
Published Jul 22, 2025

Now a flat and dusty desert playa, Oregon’s Alvord Desert once held an expansive lake that was the source of catastrophic outburst flooding.
Published Jul 22, 2025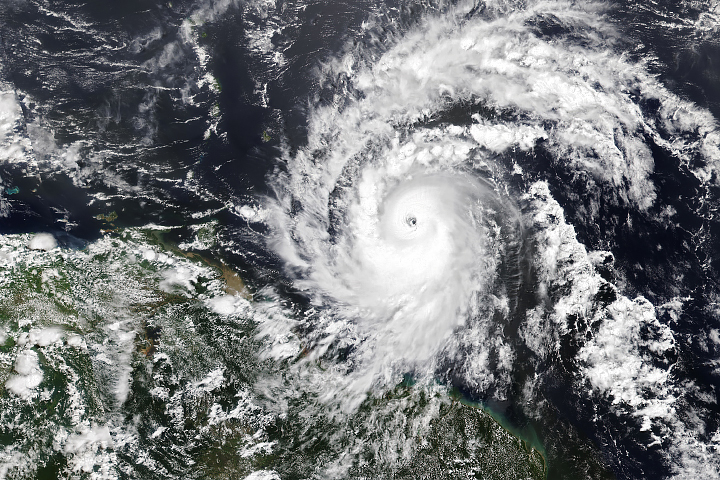
Hurricane season in the basin runs from June 1 to November 30.
Published Jul 1, 2024
Sea salt, volcanic ash, dust, wildfire smoke, and industrial pollution are types of airborne aerosols. Natural aerosols tend to be larger than human-made aerosols. These maps show when and where aerosols come from nature, humans, or both.

In addition to making rain and snow, clouds can have a warming or cooling influence depending on their altitude, type, and when they form. These maps show what fraction of an area was cloudy each month.

When fuels such as coal, wood, and oil burn incompletely, they produce carbon monoxide. The gas is spread by winds and circulation. These maps show monthly averages of CO in the lower atmosphere.
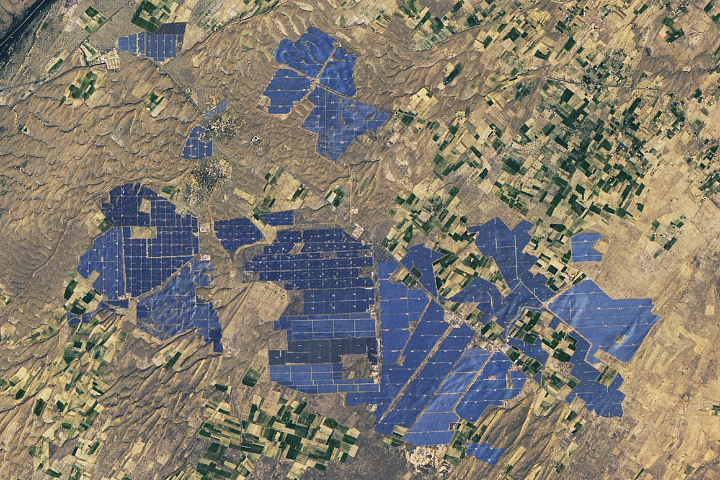
People have developed systems to harvest and store energy from sources such as wind, sunlight, and tidal action. Many of these installations are visible from orbit.
Published May 10, 2024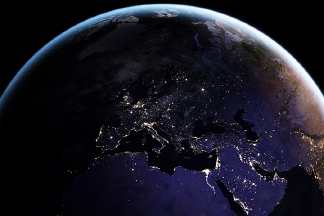
Satellite images of Earth at night have been a curiosity for the public and a tool of fundamental research for at least 25 years. They have provided a broad, beautiful picture, showing how humans have shaped the planet and lit up the darkness.
Published Apr 12, 2017
These maps depict anomalies in land surface temperatures (LSTs); that is, how much hotter or cooler a region was compared to the long-term average. LST anomalies can indicate heat waves or cold spells.
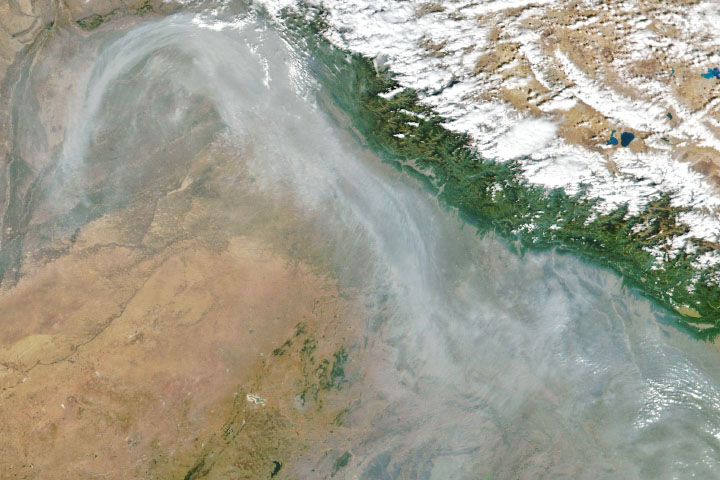
From ground-level ozone to particulate matter to nitrogen dioxide, an array of gasses and particles can affect the air people breathe, with implications for human health.
Published Apr 8, 2024
Land surface temperatures rise and fall with the heat of the Sun, and they represent how hot or cold the surface would feel to touch. These maps show daytime land temperatures as measured from space.
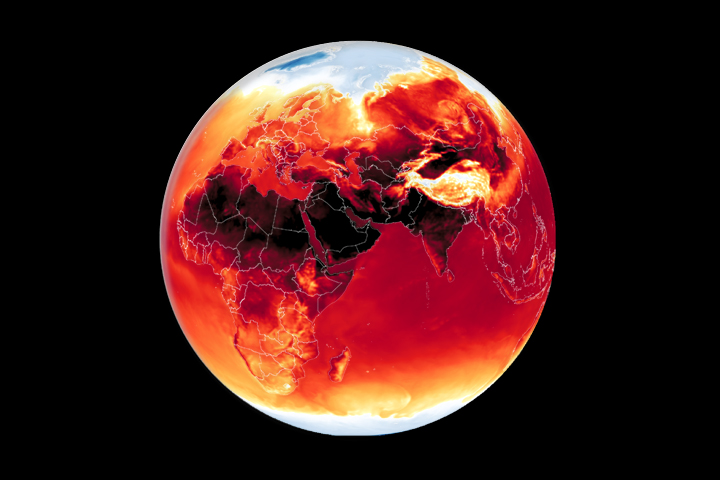
Warmer-than-average temperatures are showing up locally and globally, with consequences for people, landscapes, and ecosystems.
Published Mar 26, 2024
Whether sparked by lightning, intentional land-clearing, or human-caused accidents, wildland fires are burning longer and more often in some areas as the world warms.
Published Feb 27, 2024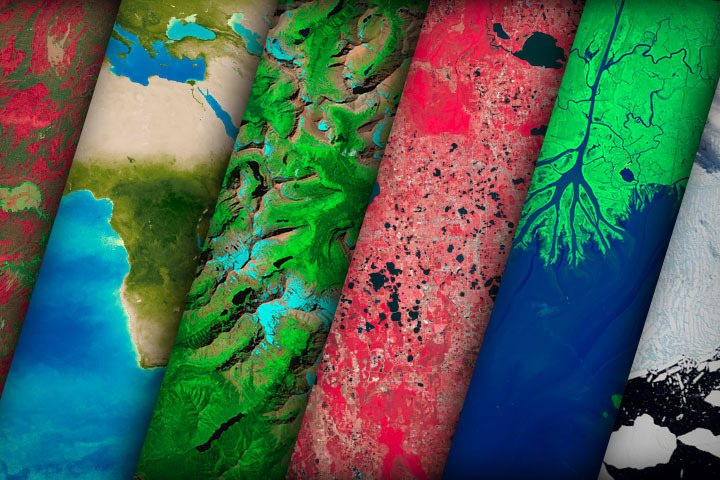
NASA satellites document how our world—forests, oceans, human landscapes, even the Sun—changes over months, seasons, and years.
Published Apr 29, 2009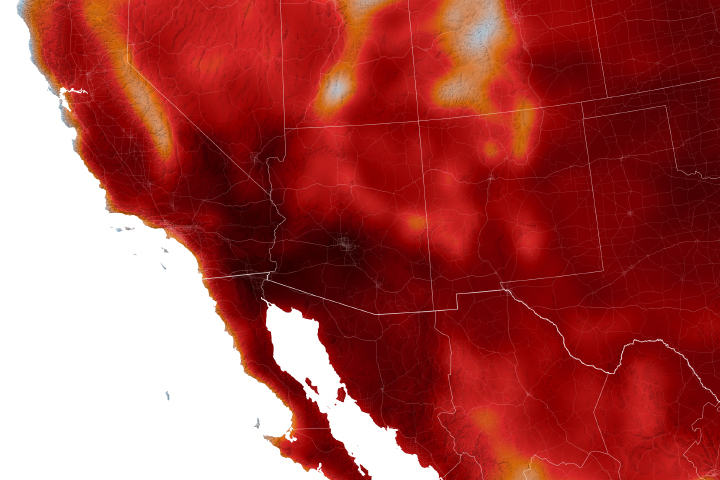
Warmer-than-average temperatures are showing up locally and globally, with consequences for people, landscapes, and ecosystems.
Published Aug 15, 2023alert message


